The fourth Multiplier Event promoted by the MYGEO Project has been held on Friday the 28.5. The event was aimed at collecting good practices and experiences by Academics and professionals making use of GIS tolls in their daily work.
The first two sessions were held by Archetipo, a high technological content company aimed to the development of new systems to optimize the survey and data processing/images acquired in the field.
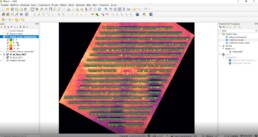
Eleonora Berto presented QGis application for analysis and visualization of image data for monitoring the efficiency of large photovoltaic systems.
In particular, Eleonora shown the thermographic analysis of photovoltaic systems, that consists essentially in 3 phases:
– Photogrammetric and topographic survey
– Creation od a 3D model geo-referenced through the ground survey
– GIS analysis
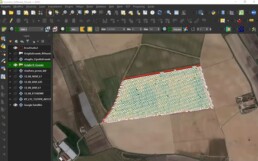
In the following session, Tommaso from Archetipo presented QGis application for analysis and visualization of image data for Precision Farming.
In this field, the main task is the processing of photos taken with drones or satellite image in order to produce vegetation growth data, variability maps and prescription maps.
This kind of work consists in 5 phases:
– Study area identification on QGis
– Data download
– Vegetation index calculation
– Mean index calculation
– Data matching
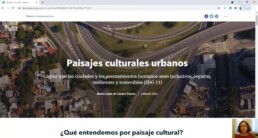
The last topic was held by Dr. Maria Luisa De Lazaro Torres, researcher from UNED, an open university based in Madrid, Spain.
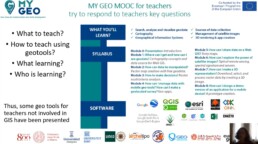
She presented the MyGeo Project output MyGeo MOOC for Teachers, an online course for teachers aimed at fostering the acquisition of key competences related to the use of GIS in higher education courses, with the ultimate objective of promoting the modernization of teaching methods and tools in higher education institutions.
Here more info about the course.
Maria Luisa De Lazaro also explained what is and how to create a Story Map, a tool that allows you to tell a story using storytelling techniques integrating maps, images, video, figures, tables, text and other resources from different sources.